
Click here for a better look
The image you see above is the entire work of "The Old Man and the Sea" in a graphical form. True to my word, if you realy want to, you can reverse the process and get the book back.
So how did I do it?
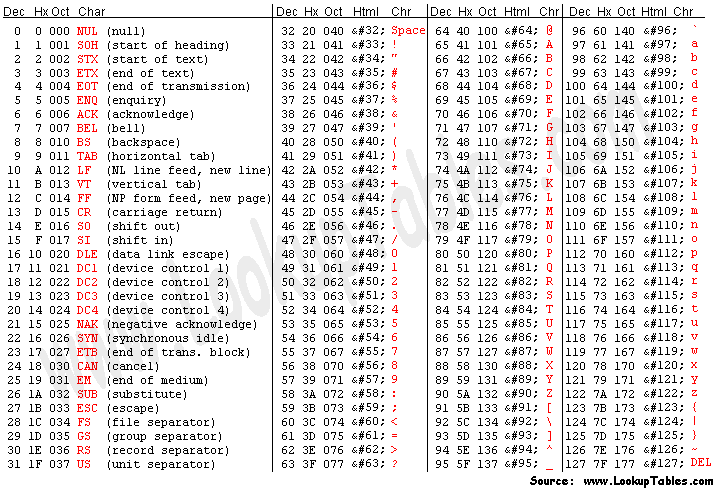
First a bit of back story is required. Ascii was one of the original text formats that was used for the storage of text files in the days of lore. It was great for anything in English but the designers realised that if they wanted to let more languages in, they'd need to change the system. The benefits of Ascii for the early computers was that it was (and still is) extremely small. The secret to this is how the raw data is stored as two hex fields. You can see what I mean HERE.
Hex basically is 0-9 with A-F appended at the end. This means that there are now 16 possible values that can be used at any time and means that it can easily be used with computers because of how it fits into the binary system. (If you can't work this out I fear for your soul)
Since I am inherently lazy, I decided against doing a system that would allow the hex to be used in the colours because it would be harder to tell the differences apart by eye. The only solution then was to split the values into half so that only 16 different colours would be necessary.
The program can now be broken into 2 parts:
1. Convert each character in the text to hex and split into two parts
2. Using the data that was processed, create an image
Because Java is absolutely horrible at text processing, I used python to sort through the text and then spit out the resulting hex codes. The original text is 129 kB in size, while the processed version is 3.79 MB.
For sake of reference, the python program was:
o = open ("list.txt","a")
f = open("old man and the sea.txt").read()
for i in range(0, len(f)):
o.write(hex(ord(f[i]))[2:-1] + "\n")
o.write(hex(ord(f[i]))[3:] + "\n")
print "The number of lines is : " + str(len(f))
To turn this into an image, I needed a bit of kit that easily allows the creation of graphics. Fortunately, I've always wanted to play with Processing which allows me to create diagrams with ease. Processing is based upon Java, so most of the syntax is the same but has its own quirks because it is a language unto itself. I'd seen some neat programs written with it in the past, so I decided that it would be the tool for the graphics.
The current code for this program is:
EDIT: Omitted because of formatting. I'll fix it later.
The image you see above is the entire work of "The Old Man and the Sea" in a graphical form. True to my word, if you realy want to, you can reverse the process and get the book back.
So how did I do it?
First a bit of back story is required. Ascii was one of the original text formats that was used for the storage of text files in the days of lore. It was great for anything in English but the designers realised that if they wanted to let more languages in, they'd need to change the system. The benefits of Ascii for the early computers was that it was (and still is) extremely small. The secret to this is how the raw data is stored as two hex fields. You can see what I mean HERE.
Hex basically is 0-9 with A-F appended at the end. This means that there are now 16 possible values that can be used at any time and means that it can easily be used with computers because of how it fits into the binary system. (If you can't work this out I fear for your soul)
Since I am inherently lazy, I decided against doing a system that would allow the hex to be used in the colours because it would be harder to tell the differences apart by eye. The only solution then was to split the values into half so that only 16 different colours would be necessary.
The program can now be broken into 2 parts:
1. Convert each character in the text to hex and split into two parts
2. Using the data that was processed, create an image
Because Java is absolutely horrible at text processing, I used python to sort through the text and then spit out the resulting hex codes. The original text is 129 kB in size, while the processed version is 3.79 MB.
For sake of reference, the python program was:
o = open ("list.txt","a")
f = open("old man and the sea.txt").read()
for i in range(0, len(f)):
o.write(hex(ord(f[i]))[2:-1] + "\n")
o.write(hex(ord(f[i]))[3:] + "\n")
print "The number of lines is : " + str(len(f))
To turn this into an image, I needed a bit of kit that easily allows the creation of graphics. Fortunately, I've always wanted to play with Processing which allows me to create diagrams with ease. Processing is based upon Java, so most of the syntax is the same but has its own quirks because it is a language unto itself. I'd seen some neat programs written with it in the past, so I decided that it would be the tool for the graphics.
The current code for this program is:
EDIT: Omitted because of formatting. I'll fix it later.
The colours were decided by just doing a range of 0-240 in the hue of the colour (it goes up by 16 each time). In case you were wondering, the reason why there is so much purple is because appears very often in the file, which is set (currently) to purple.
Future Developments
Automatic resolution adjustments (picks the optimum resolution)
Better control for colours depending on the frequency of the value
If you want to know more on how the processing or python code works, just ask in the comments section.


Interesting Nathan - but what has this got to do with your current Dossier problem? What have you been doing in completing Part A of the Dossier - Which is due on Monday 3:30pm???
ReplyDelete